Blogs
Blogs are submitted from NHS-R Community members.
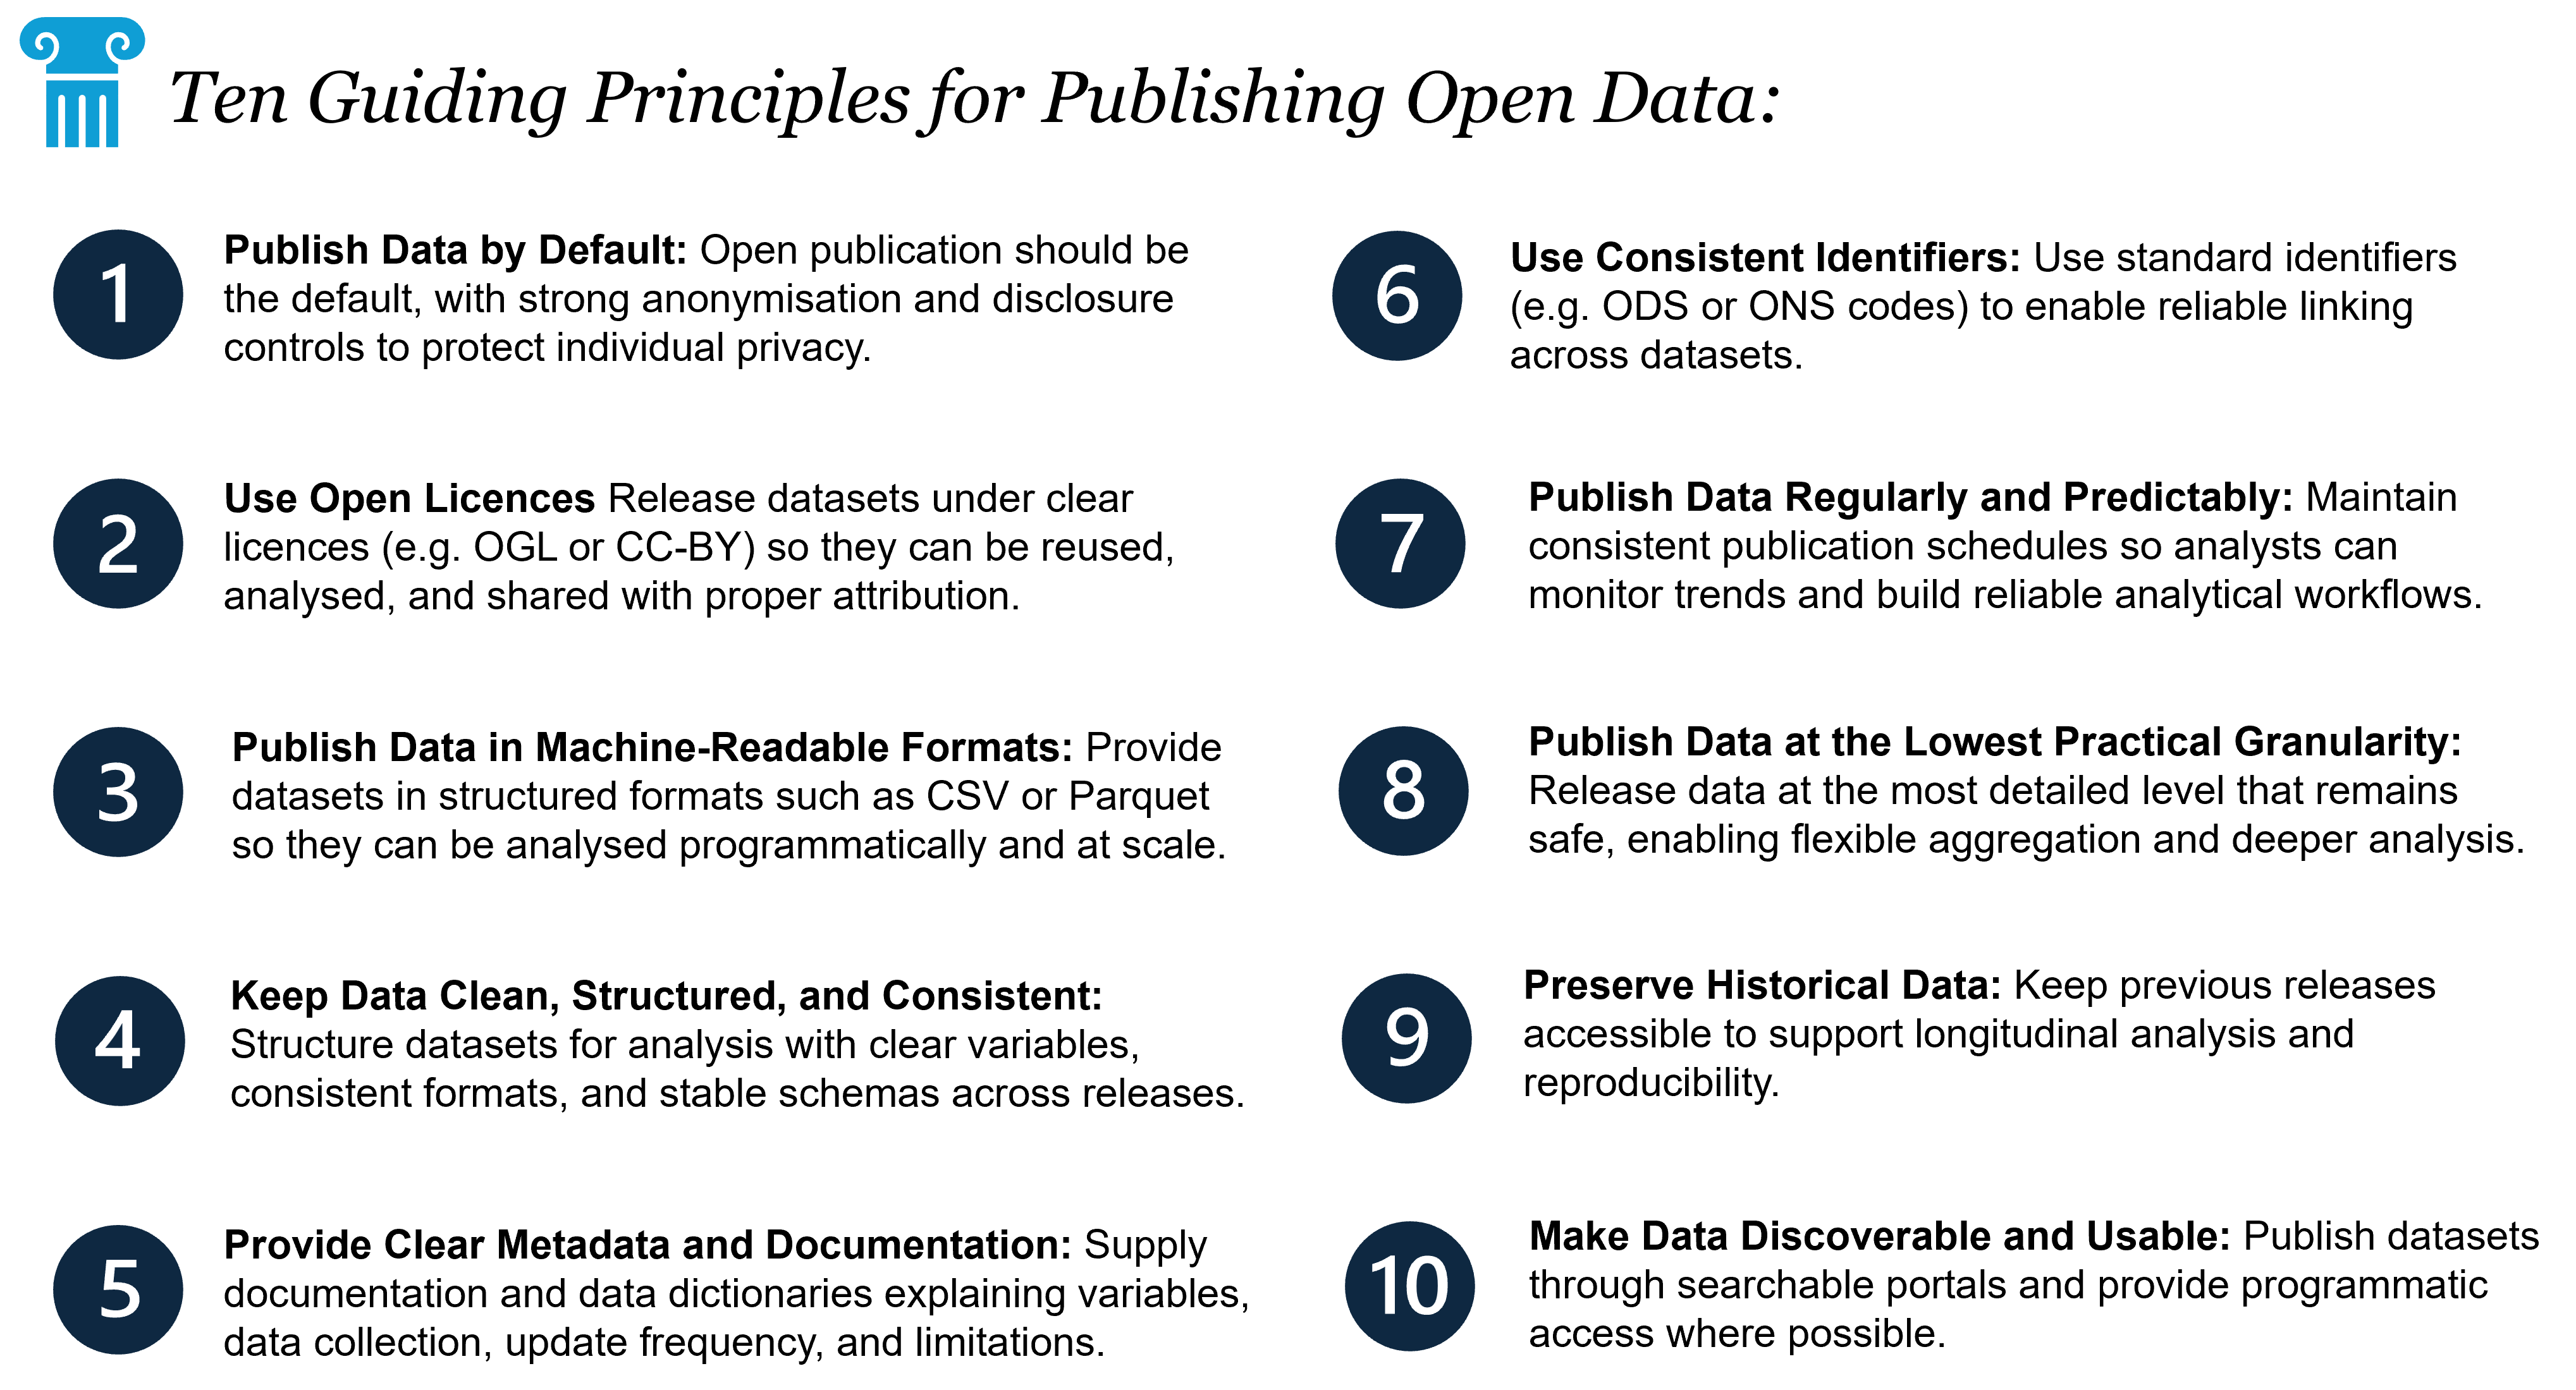
Why Open Data Matters
Open Health Data
Reproducible Analytics
Population Health
Data Standards
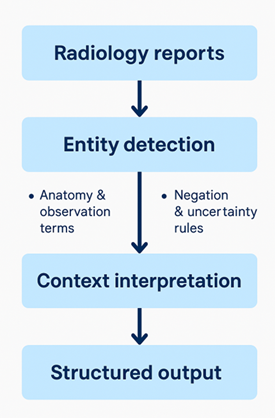
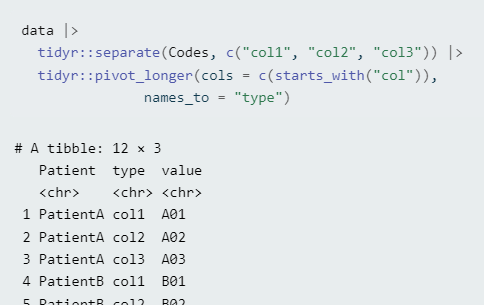
Quality Assurance without the spreadsheets
R
QA
github
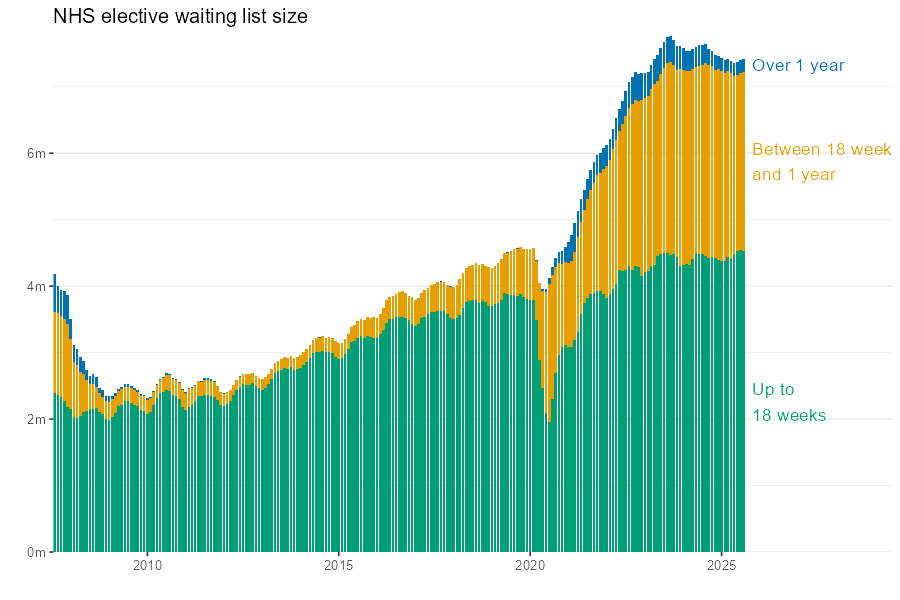
The RTT Planner tool for elective waitlist modelling – a collaboration success story!
Git
Shiny
Collaboration
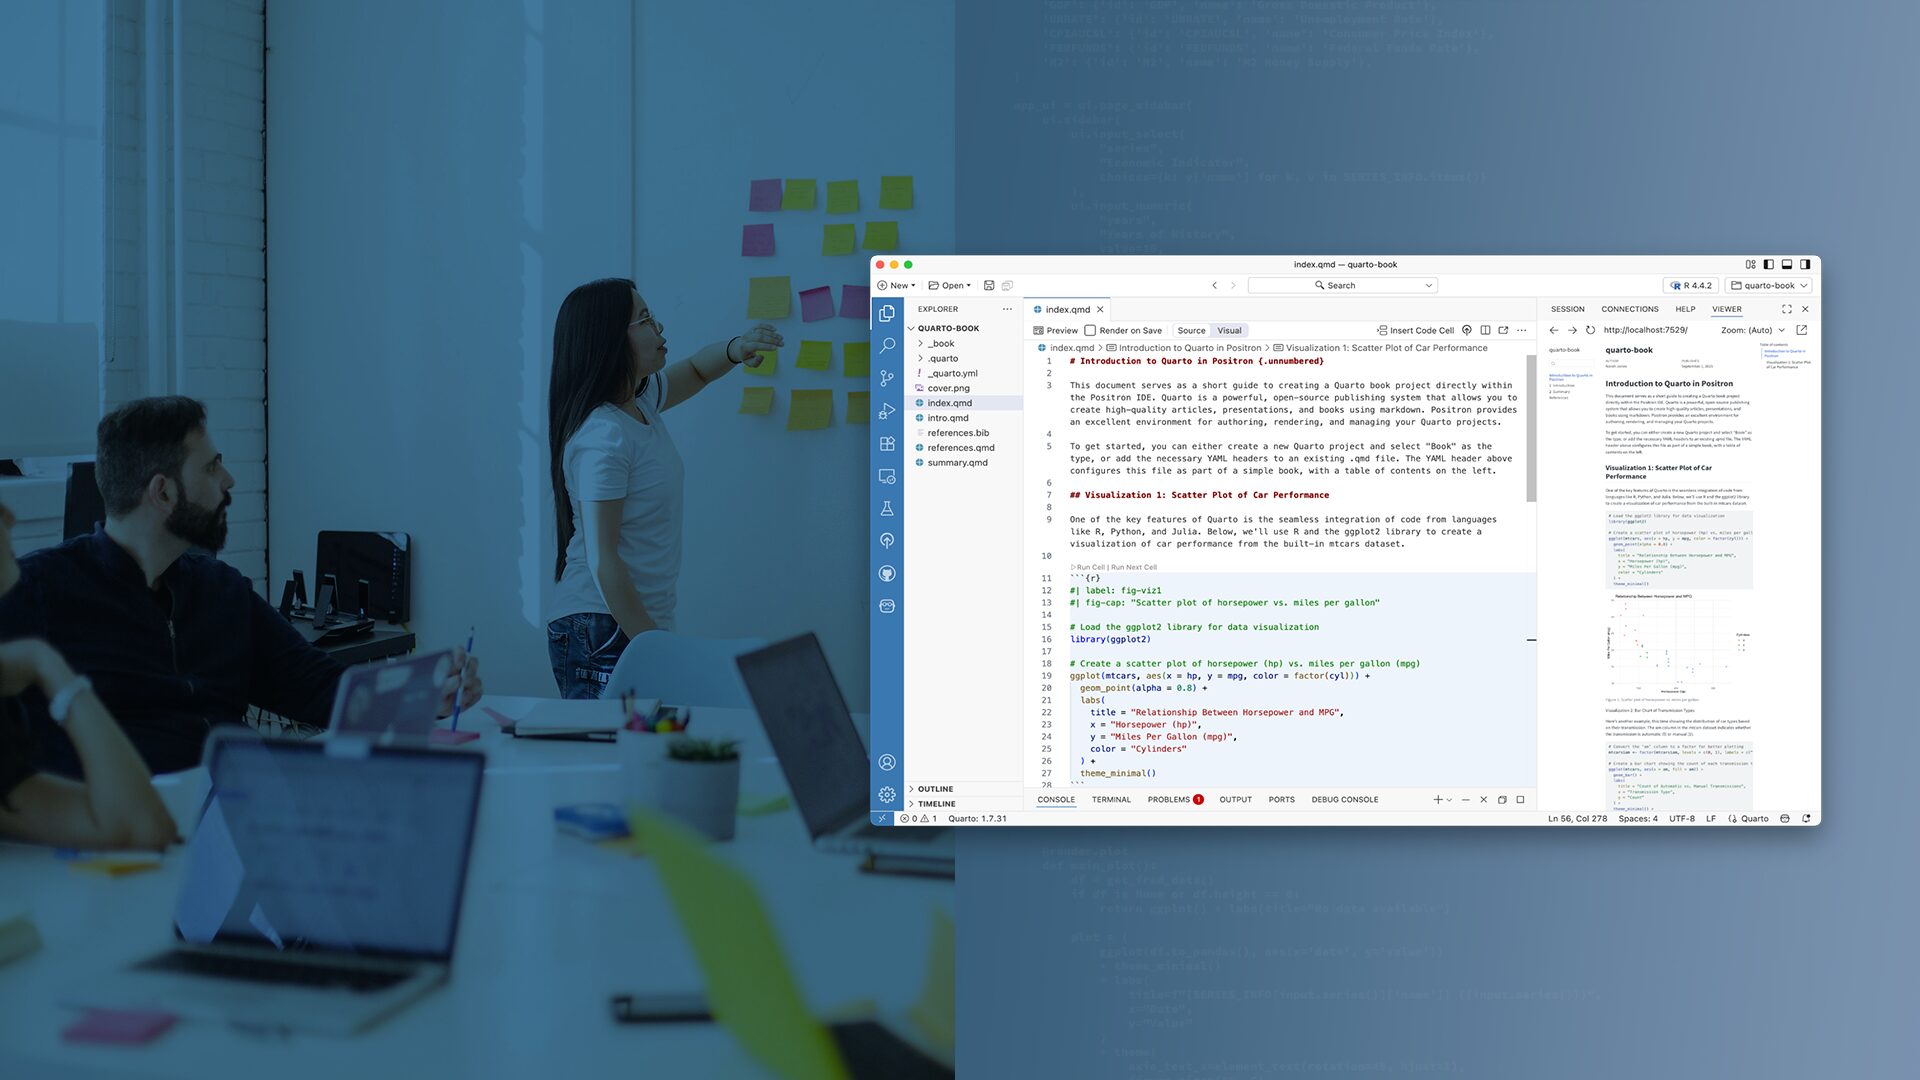
Positron for Product Owners
R
Positron
Git

Predictive Analytics within healthcare - XG Boost models for inpatient fall risk predictions
Predictive Analytics
Machine Learning


Predictive Analytics within healthcare - Random Forest models for predicting length of stay
Predictive Analytics
Machine Learning
dplyr
SQL
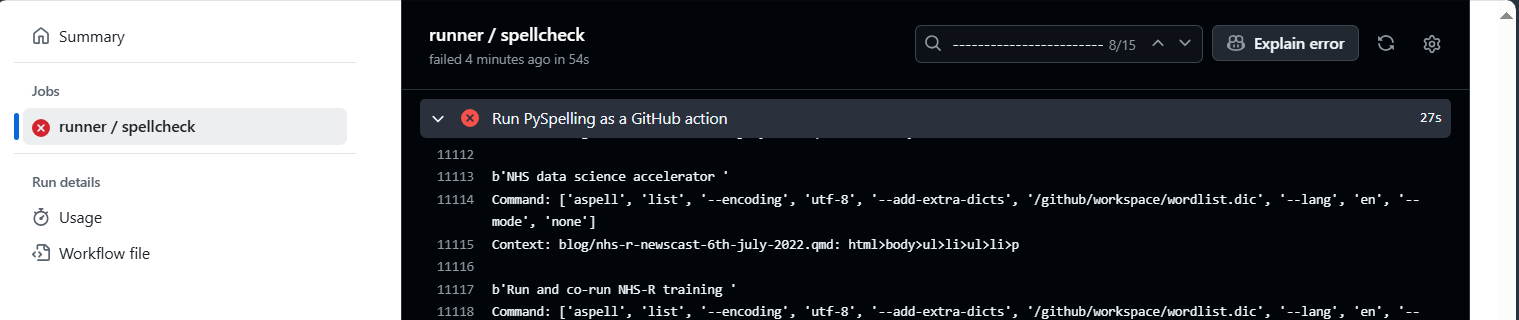
NHS-R Community GitHub Actions - spelling
GitHub Action


How to ask for help
NHS-R
R tips

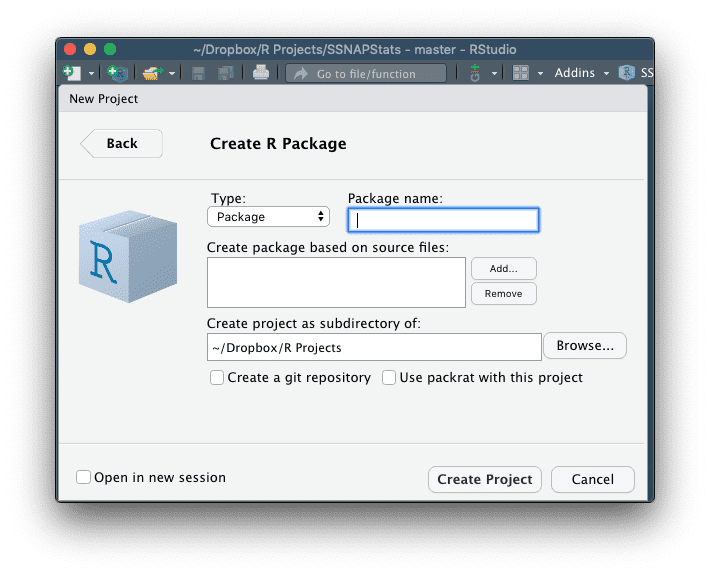
Publish on GitHub
GitHub
RMarkdown
Quarto
![]()
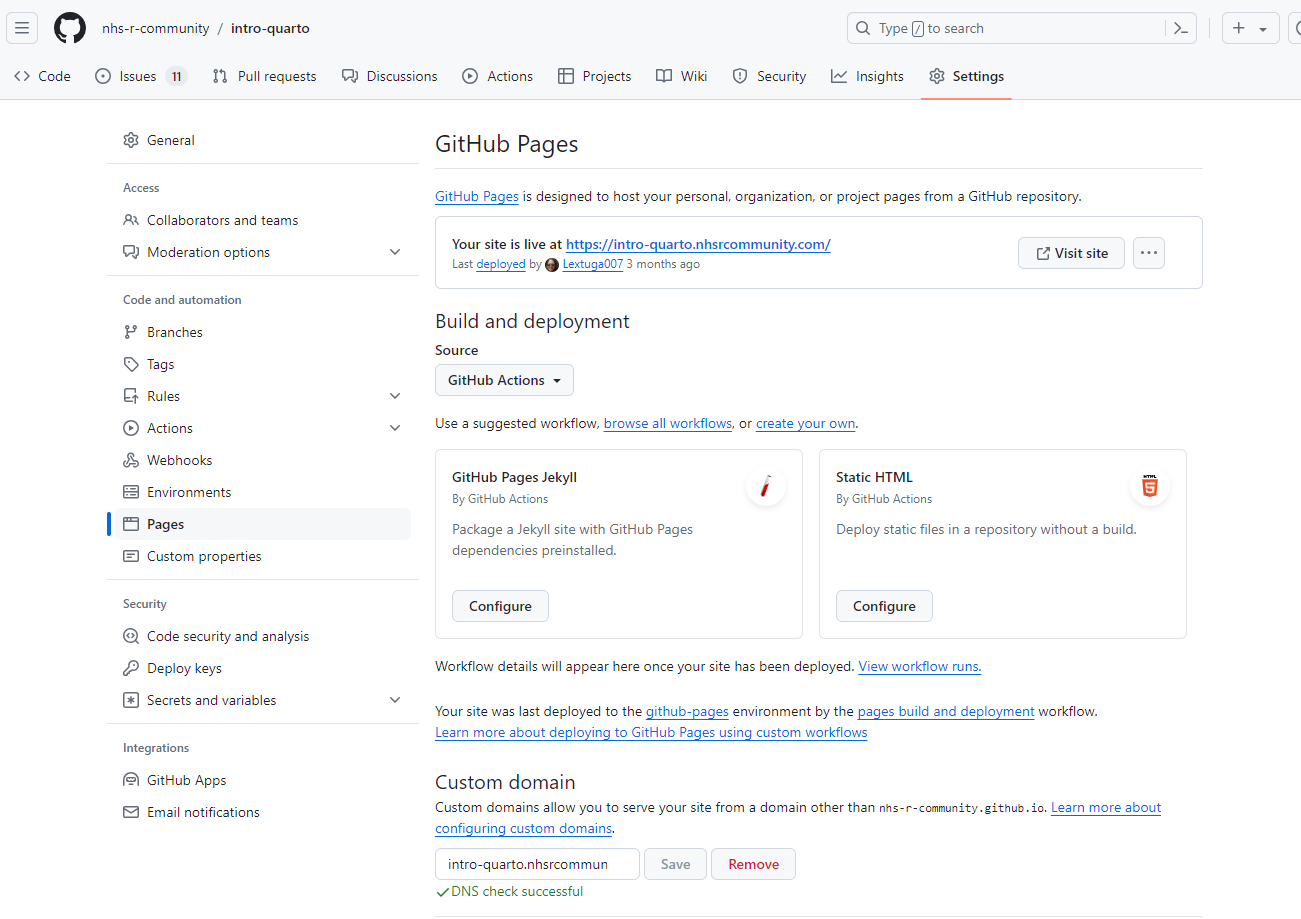
Building a Quarto website for NHS-R Community
Reflections

Coffee and Code
NHS-R
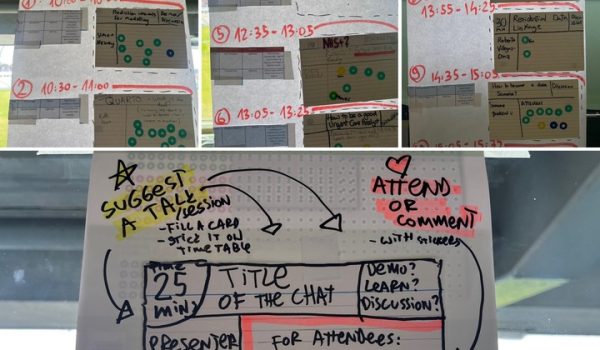
What was the “Unconference”?
Conference
![]()
AphA blog – August 2023
NHS-R
![]()
July Blog
NHS-R
![]()
AphA June Blog
NHS-R
![]()
NHS-R newscast 20th July 2023
NHS-R
Podcast
![]()
NHS-R newscast 25th May 2023
NHS-R
Podcast
![]()
AphA blog – May 2023
NHS-R
SQL
RStudio and Git – selecting many files
RStudio
Git
![]()
AphA April 2023 Blog
NHS-R
Code snippets – 2 scale y axes in {ggplot2}
ggplot2
R tips


Code snippets – regular expressions
Strings
R tips
![]()
Guest blogger – ChatGPT
NHS-R
Podcast

Fuzzy joining tables using string distance methods
Strings
tidyverse
![]()
NHS-R newscast 16th January 2023
NHS-R
Podcast


Posit + NHS-R: a Perfect Partnership!
NHS-R
Conference
![]()
NHS-R newscast 28th October 2022
NHS-R
Podcast

A dbplyr-based Address Matching Package
dbplyr
Addresses
Using RMD for academic writing
RMarkdown
![]()
NHS-R newscast 15th August 2022
NHS-R
Podcast
![]()
NHS-R newscast 6th July 2022
NHS-R
Podcast


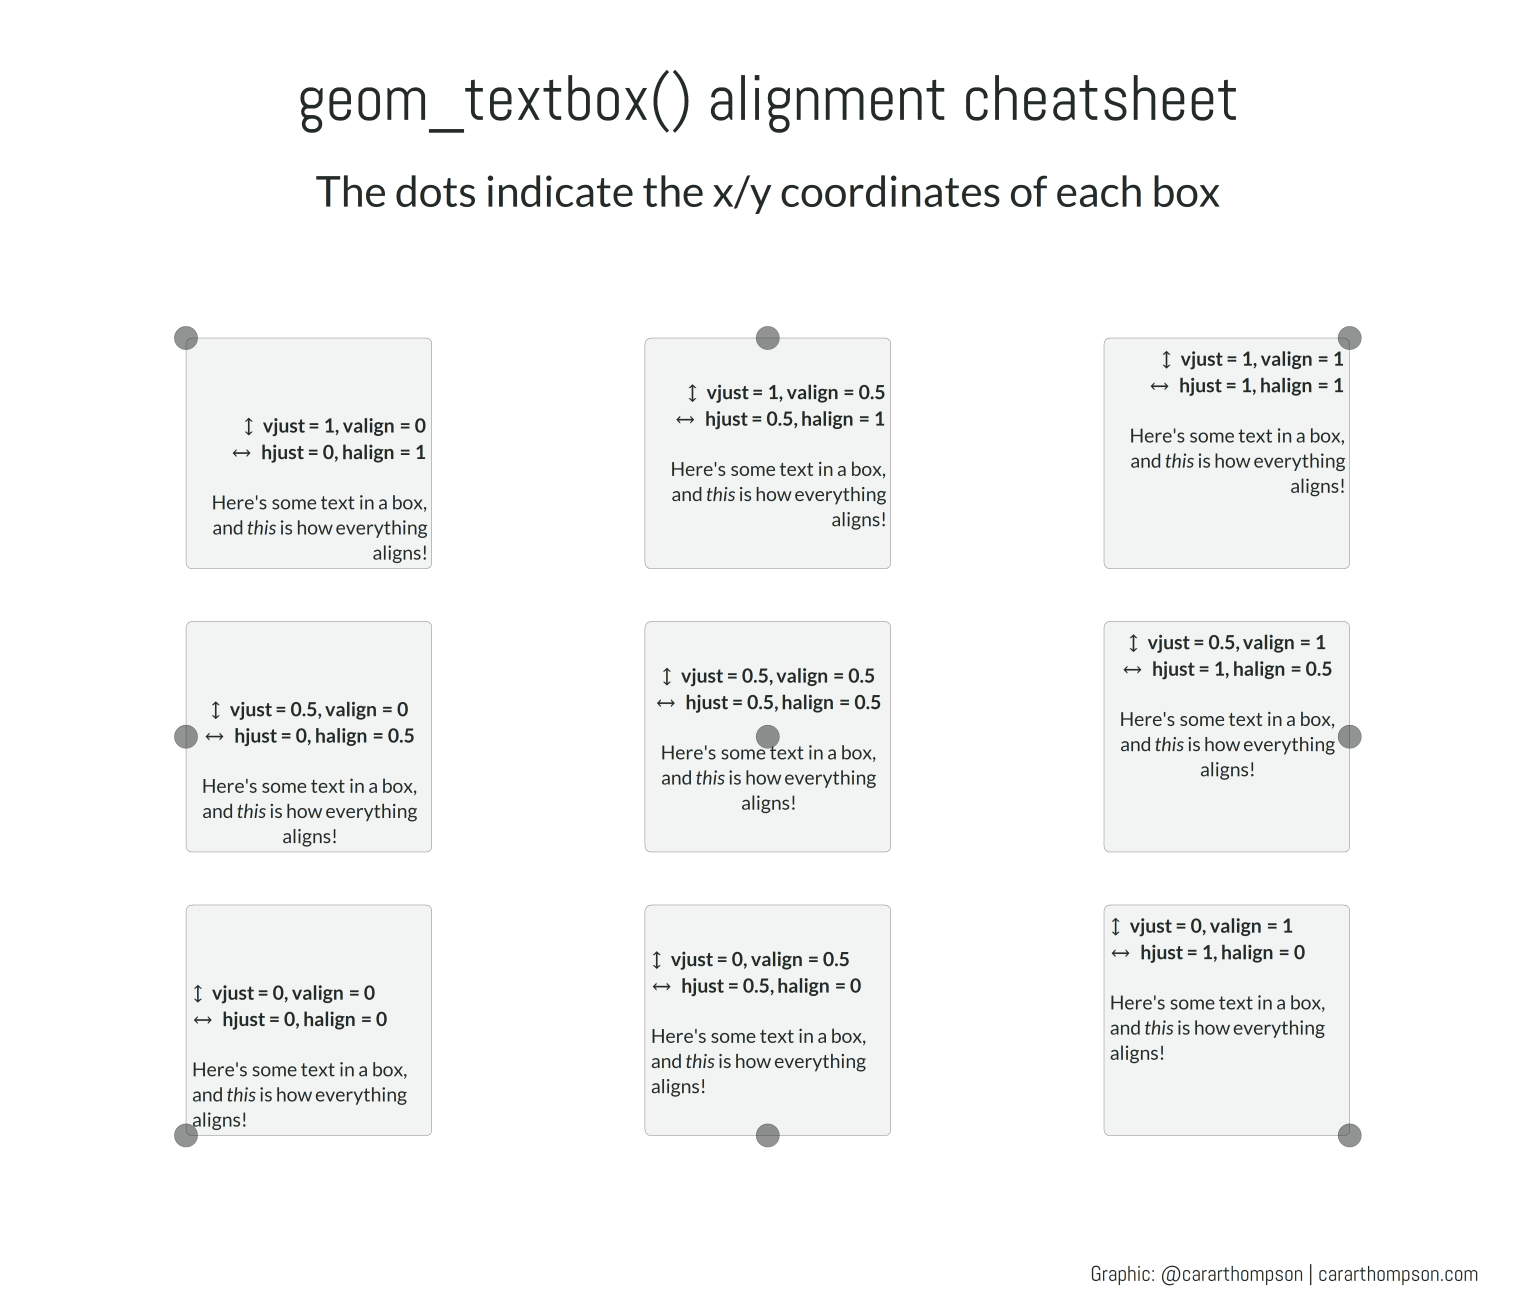
Alignment cheatsheet
ggplot2
tidyverse
Visualisations

NHS Low Income Scheme
golem
shiny
html
Accessibility
Scrollytell
![]()
Join the fun! Join NHS-R
NHS-R
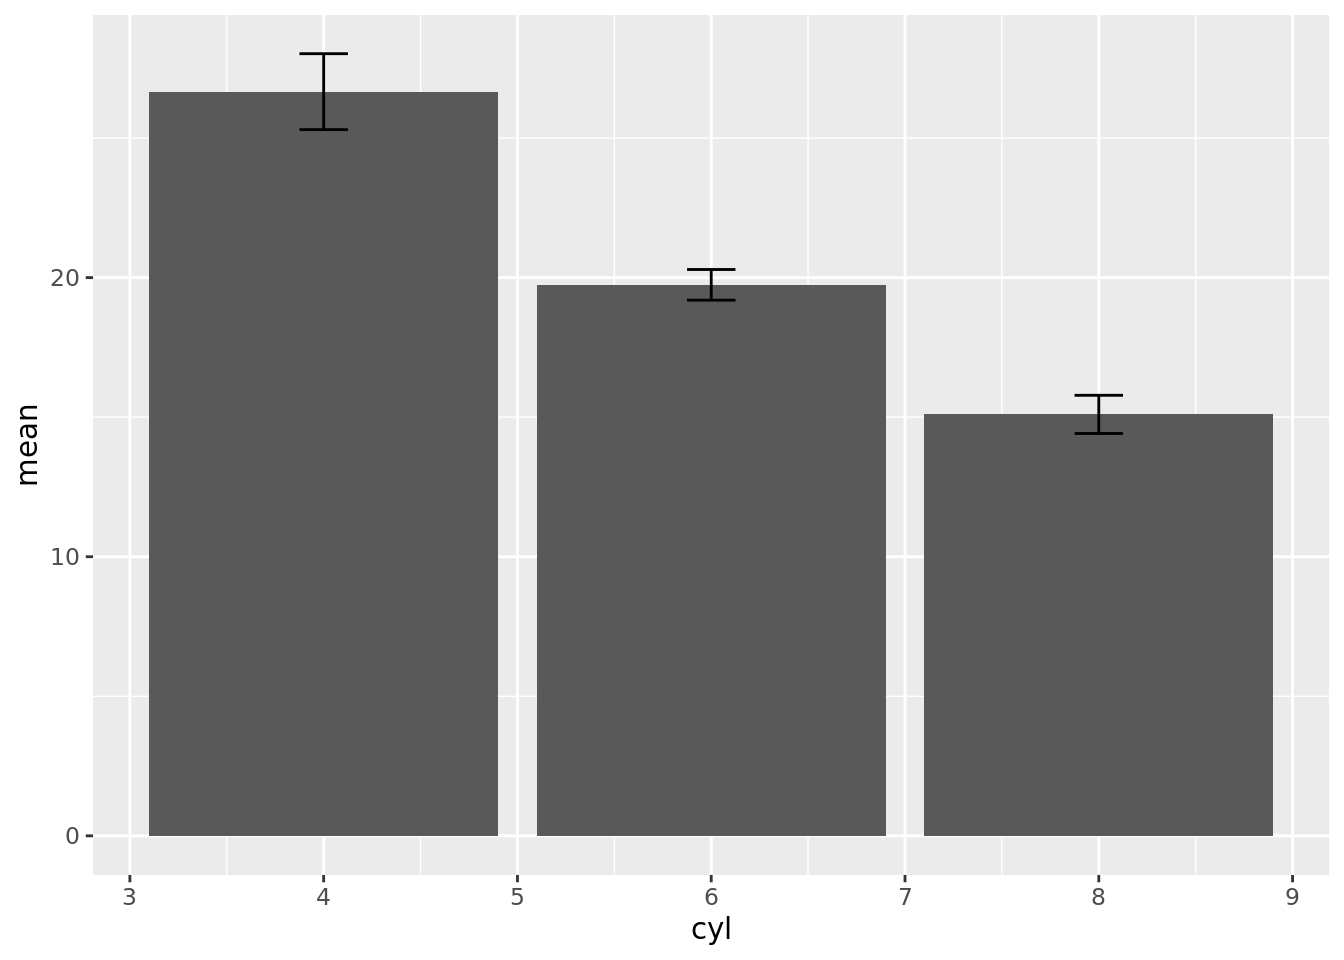
Using R to create column charts featuring 95% confidence intervals
Statistics
tidyverse
ggplot2
Public Health
![]()
Designing my first Shiny dashboard
Shiny
Functions
tidyverse
base R
GIS
zoo
plotly
![]()
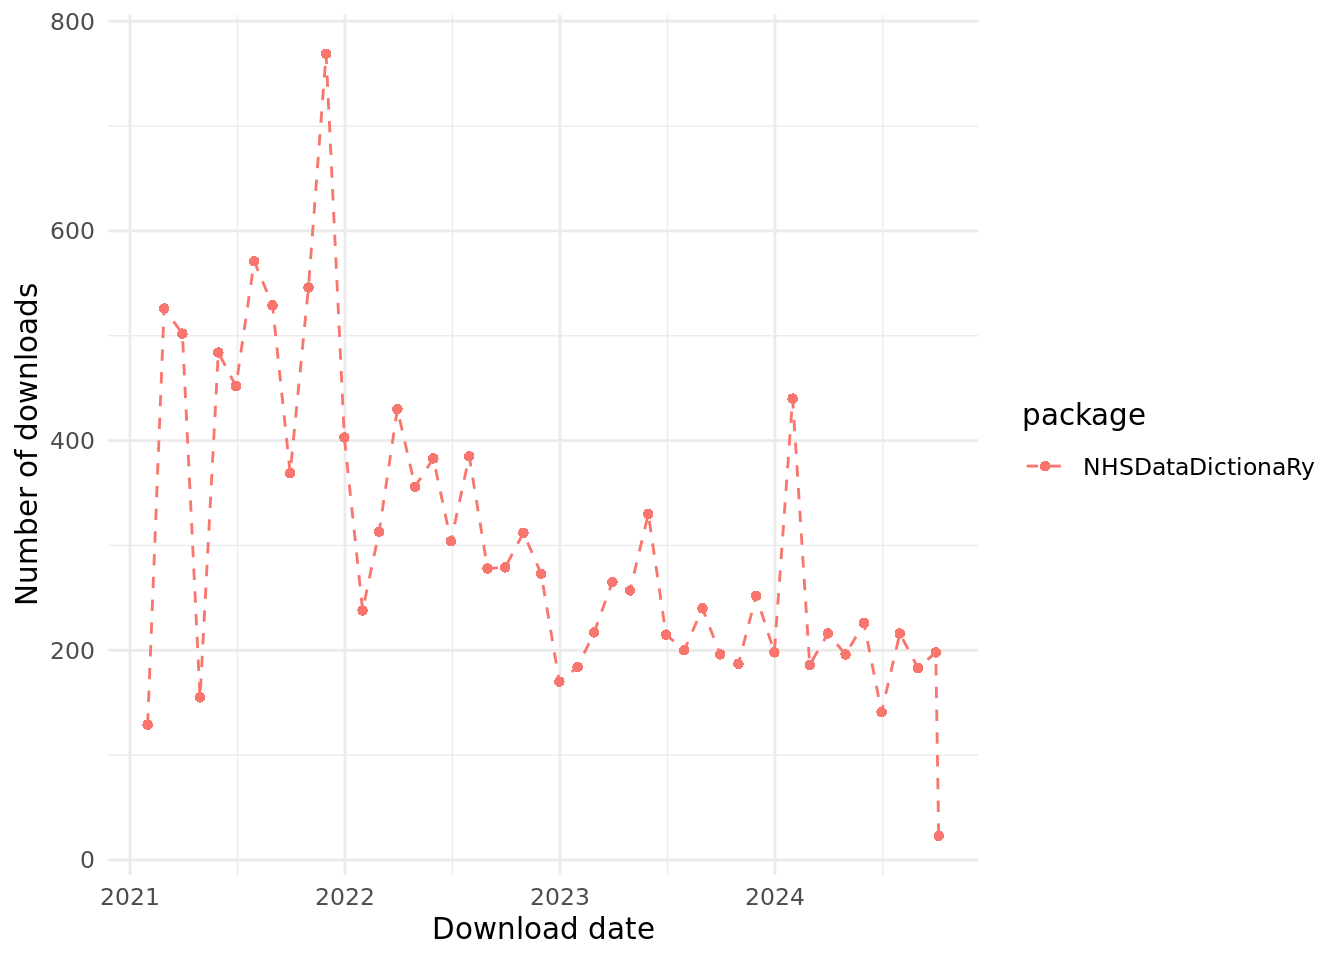
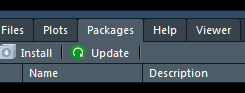
Tracking and getting download statistics for your R packages
Packages
Functions
Lists
tidyverse
![]()
Optimising dplyr
dplyr
data.table
tidyverse
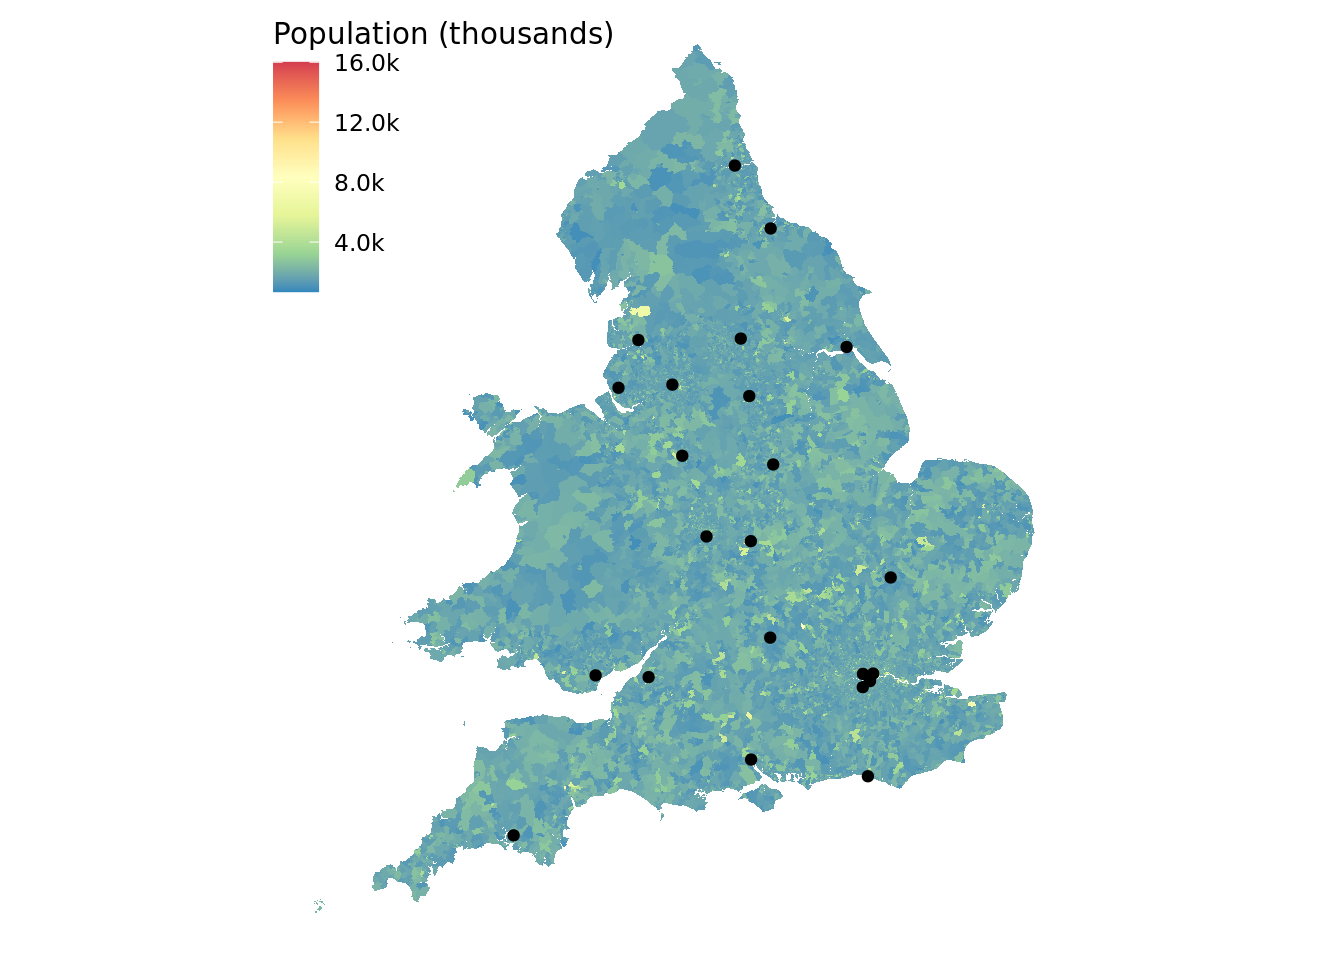
Using {sf} to calculate catchment areas
GIS
ggplot2

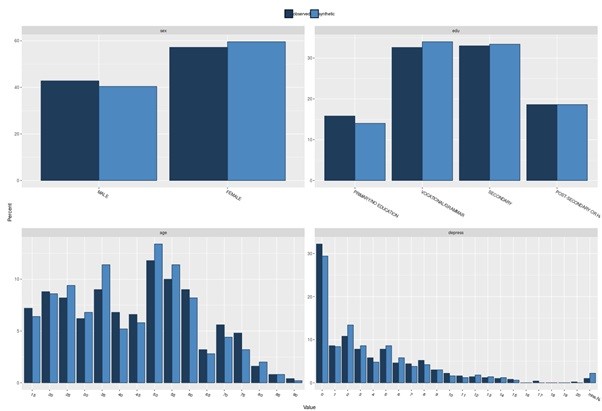
Can we rely on synthetic data to overcome data governance issue in healthcare?
Synthetic dataset
Data
base R
![]()
Software licensing
NHS-R
Learned from Community
NHS-R
Discrete Event Simulation
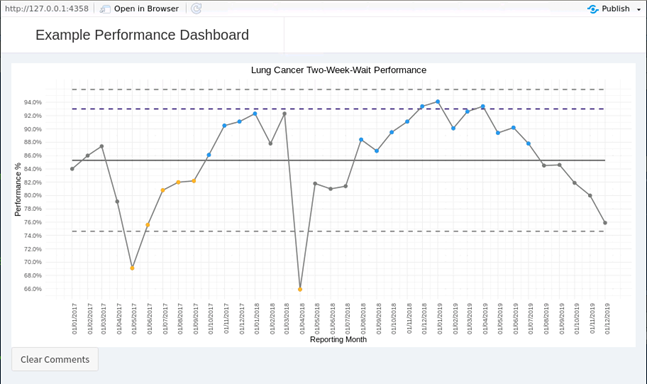
Two-Way Business Intelligence – Partnering Shiny and SQL to Capture Insights in Performance Reporting
SPC charts
Statistics
Shiny
SQL
NHS-R Book Club
NHS-R
![]()
Member profile - Robin Hinks
Personal experience
Annotating SPC plots using annotate with ggplot
SPC charts
Statistics

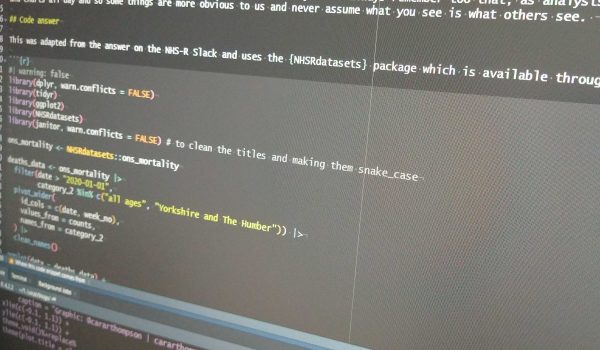
Building the ONS mortality dataset
Data
Packages
Training
dplyr
Functions
Loops
Web scraping
![]()
SPC Charting in R
SPC charts
Statistics
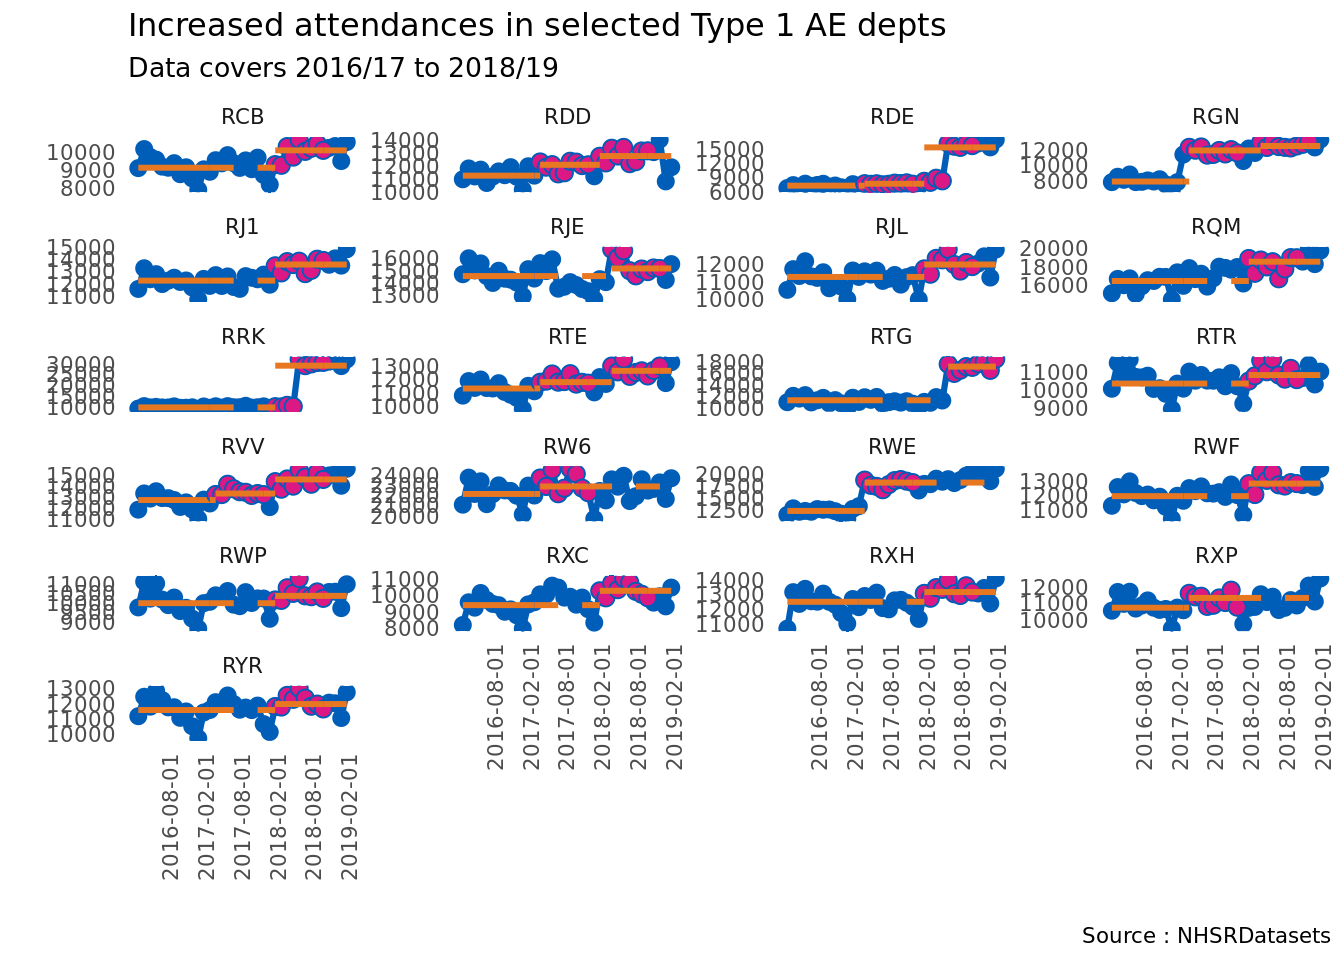
NHSRdatasets meets runcharter
Data
Packages
Run charts
Statistics
Don’t Repeat Yourself!
Functions
Data
![]()
How NHS-R Community do The Apprentice…
Personal experience
Training
![]()
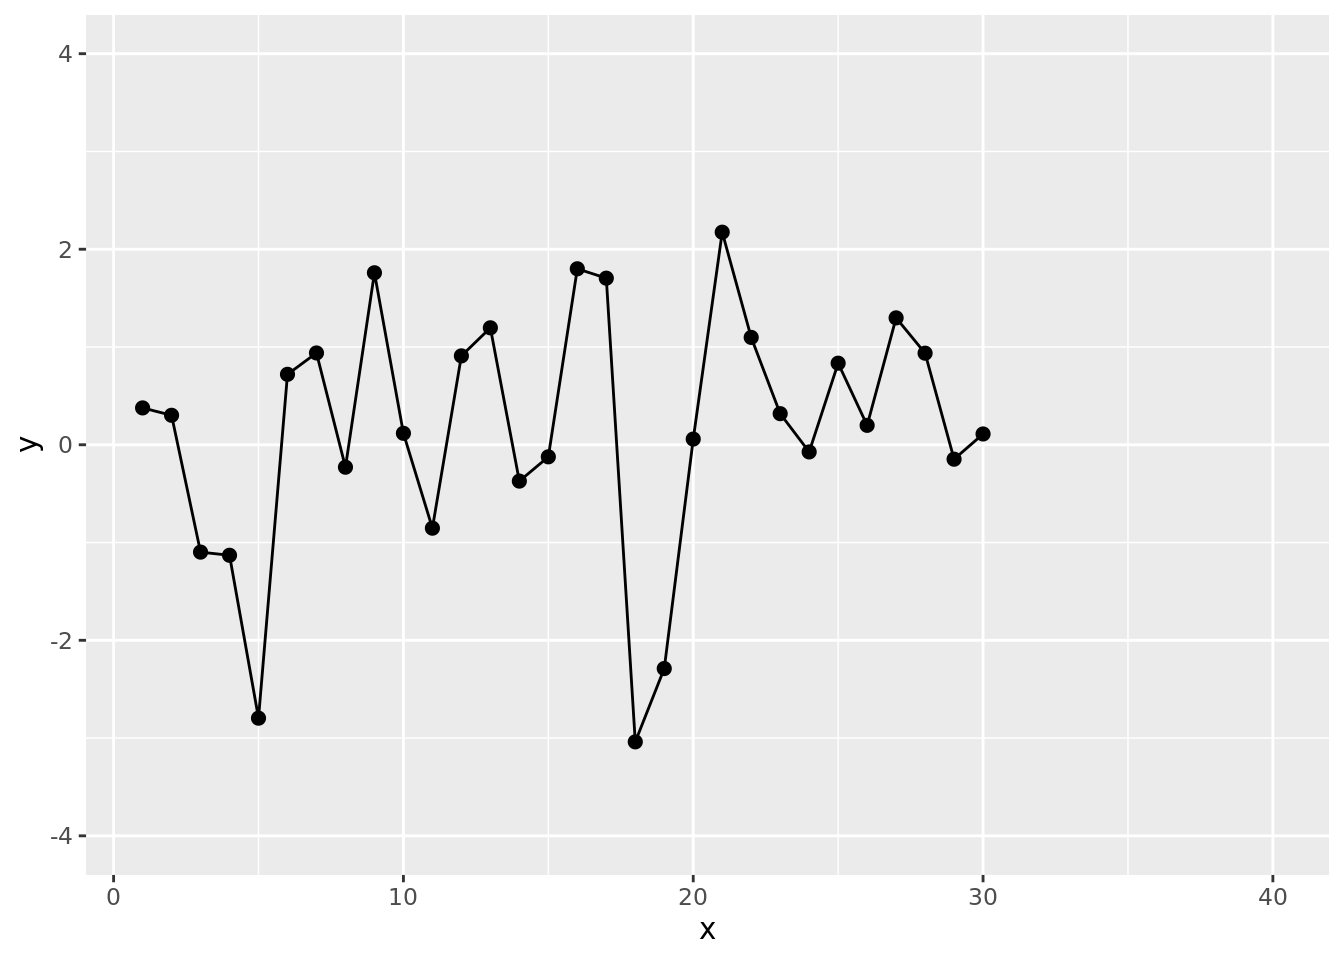
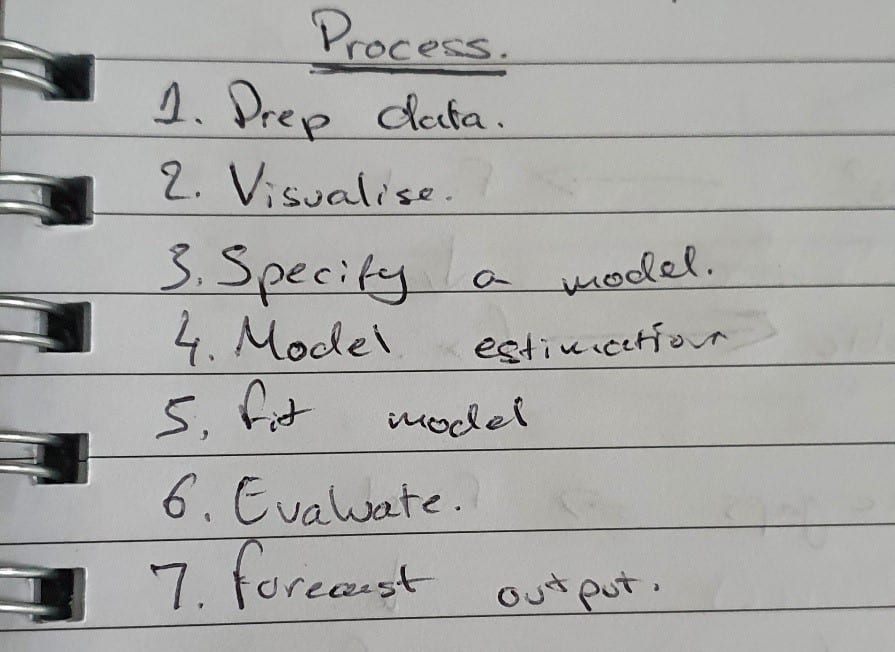
Forecasting R
Forecasting
![]()
NHS-R Community Conference II
Personal experience
Welcome to Leeds
Personal experience
![]()
A new kid on the NHS-R block
Personal experience
![]()
NHS Number Validation
NHS
Packages
The NHS-R Conference 2019
Conference
![]()
NHS-R Community datasets package released
Packages
Data
![]()
How R changed me as an analyst
Personal experience
![]()
Dygraphs
dygraphs
dplyr
base R
Exact Matching in R
R tips
Statistics
data.table
Data

Count of working days function
Functions
Introduction to Funnel Plots
Statistics
ggplot2
base R
![]()
Moving on with the plan… And using R to do it! My personal experience…
Personal experience
![]()
Format ONS spreadsheet
R tips
dplyr
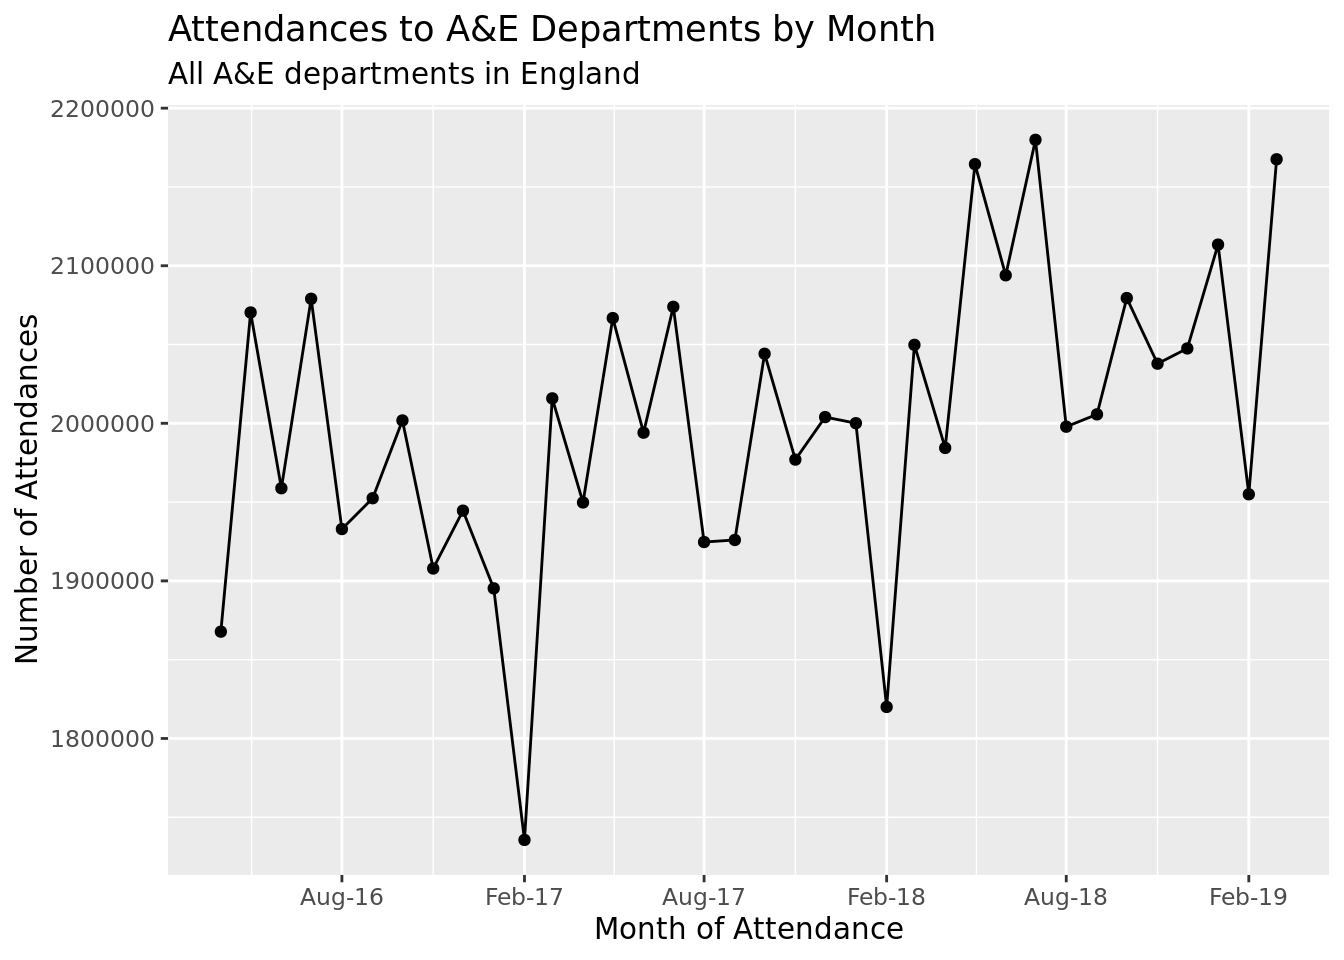
Using R to track NHS winter pressures
NHS
ggplot2
dplyr
base R
Data
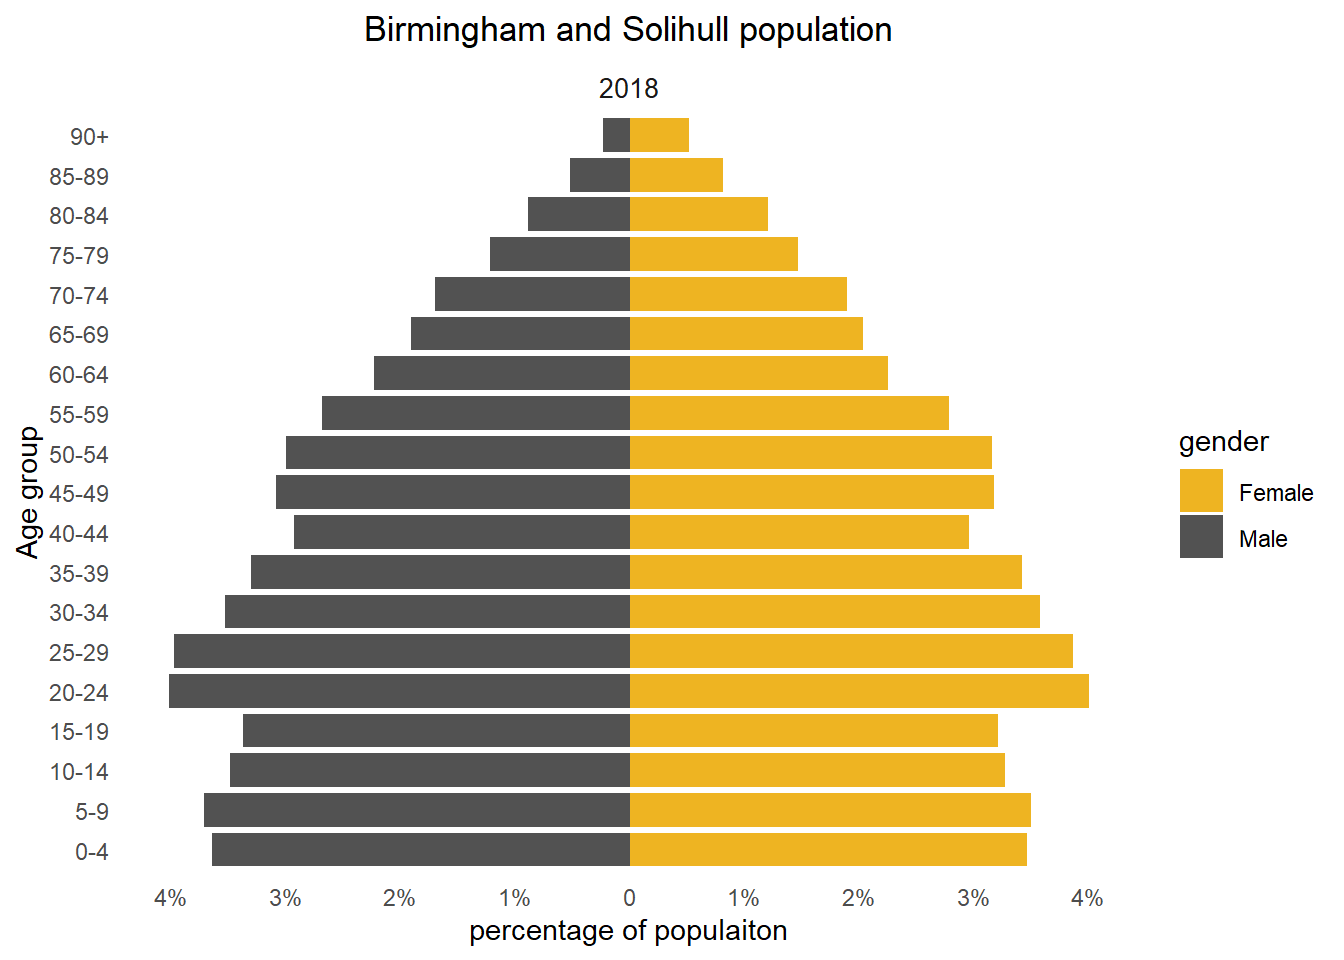
Animated Population pyramids in R: part 1
base R
Visualisations
tidyverse
ggplot2
Population
Animating a Graph Over Time in Shiny
R tips
shiny
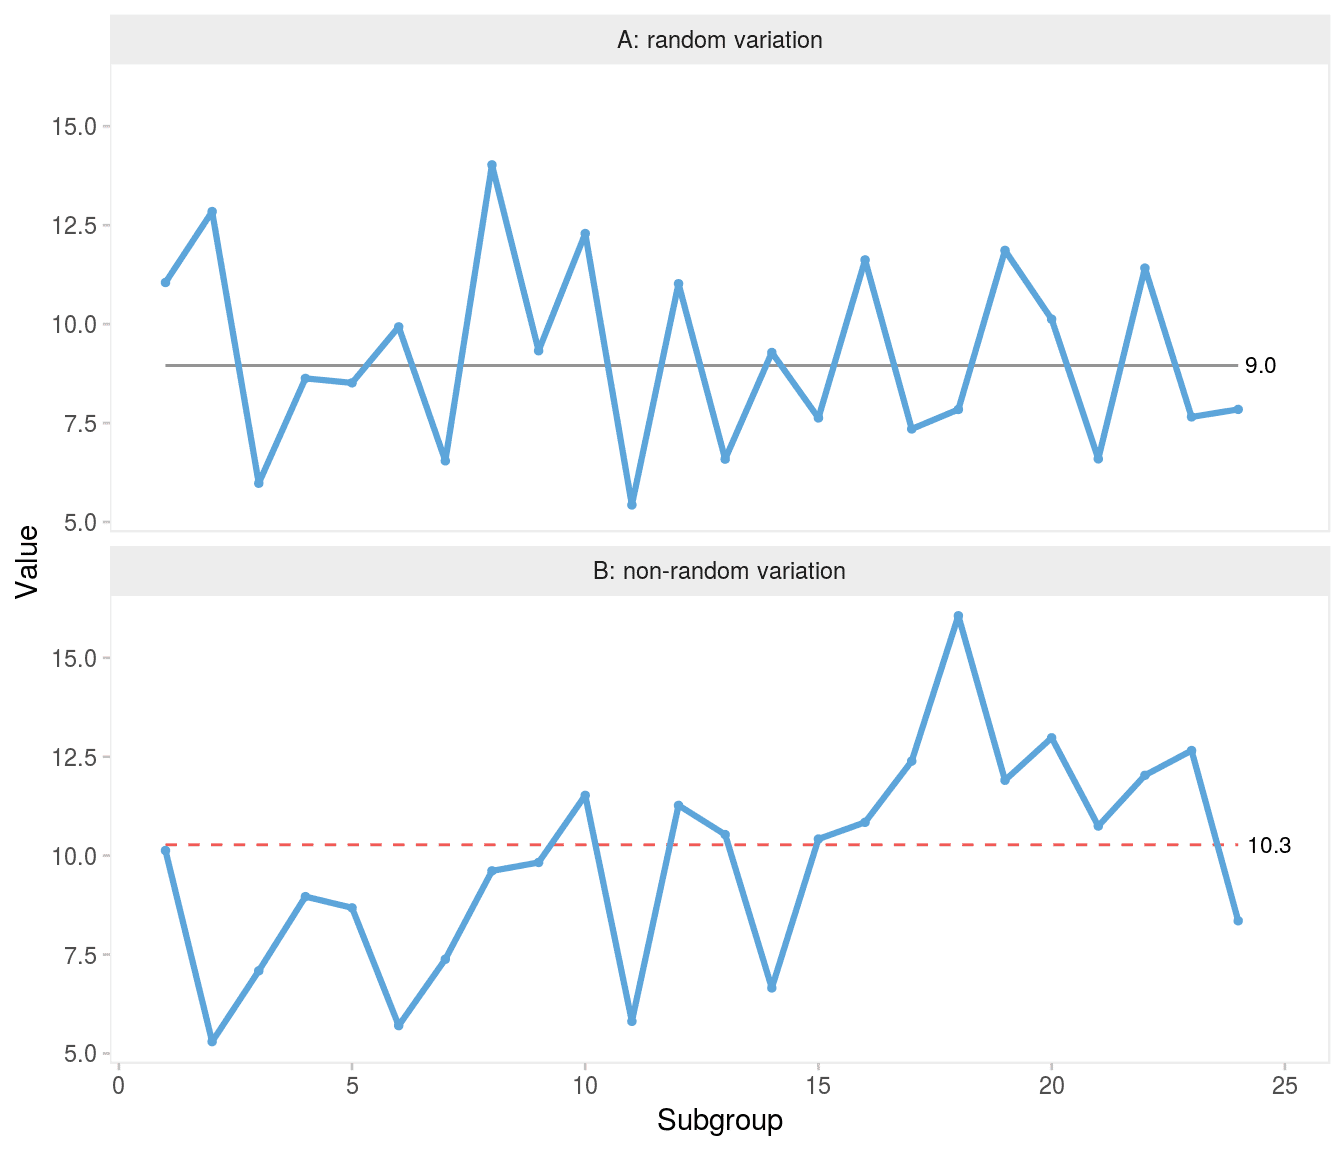
A run chart is not a run chart is not a run chart
Run charts
Statistics
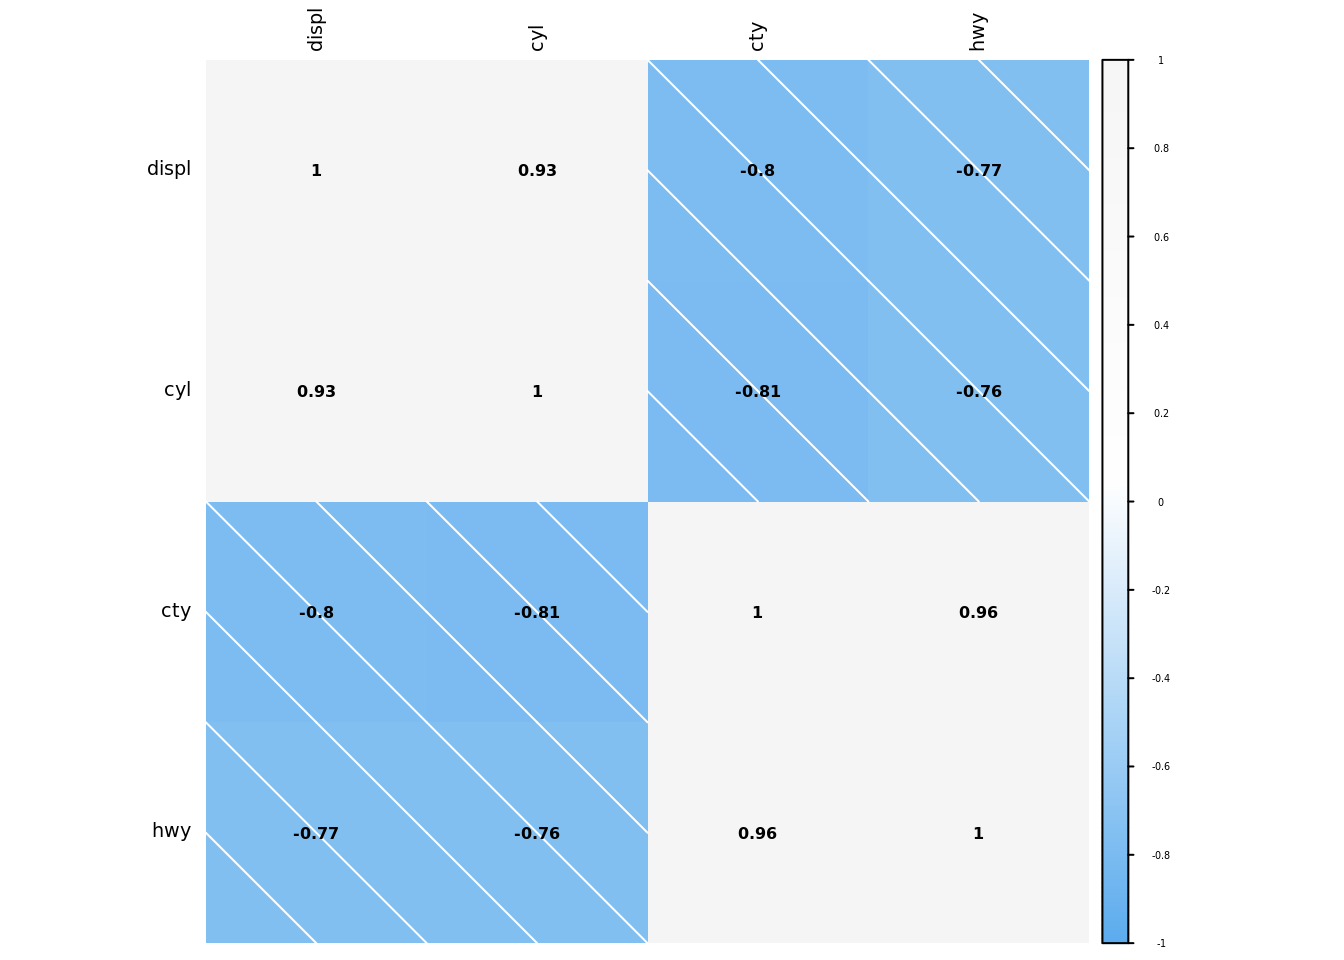
A simple function to create nice correlation plots
Functions
Statistics
But this worked the last time I ran it!
Packages
Debugging
Public Health
![]()
Local Public Health joins the paRty
Reflections
Public Health
![]()
Thoughts on the NHS-R conference
Conference
![]()
NHS-R Conference: was it worth it?
Conference
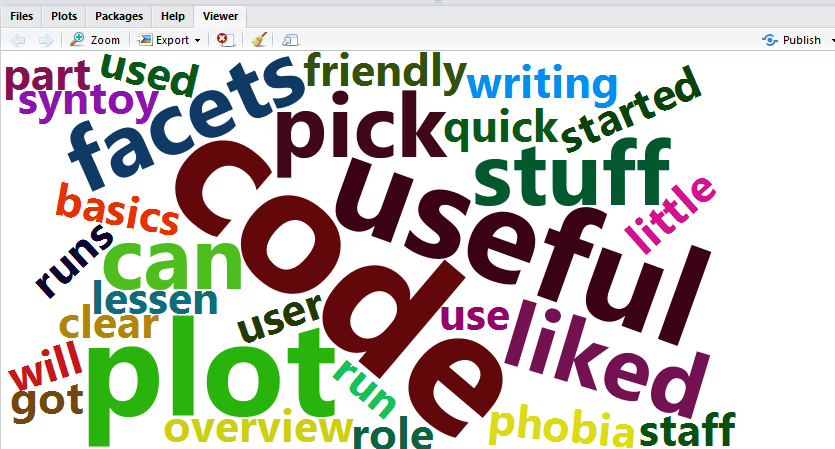
Text Mining – Term Frequency analysis and Word Cloud creation in R
Text Mining
Conference
![]()
![]()
NHS open source public datasets – creating realistic synthetic datasets
Synthetic dataset
Data

Evolution of the R user
Reflections
![]()
Even Simpler SQL
R tips
SQL
dplyr
Patient Flow
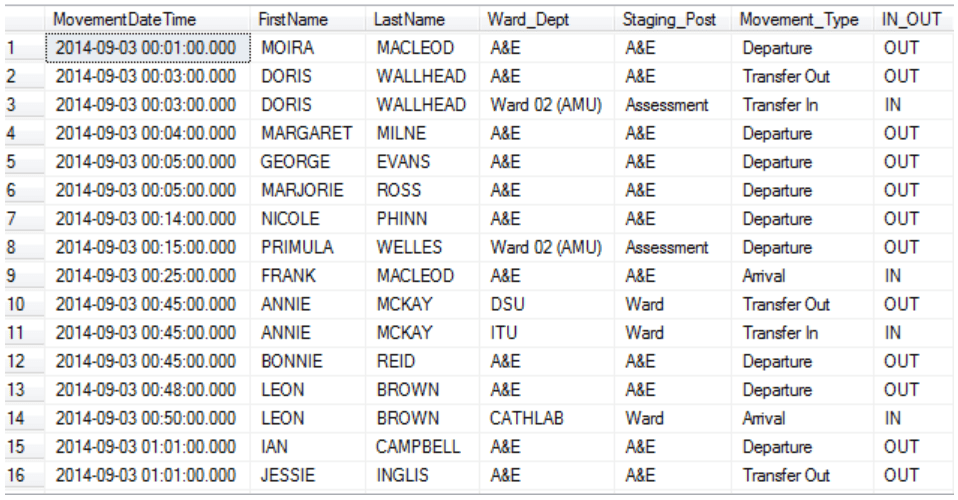
Simpler SQL with {dplyr}
R tips
SQL
dplyr
Patient Flow
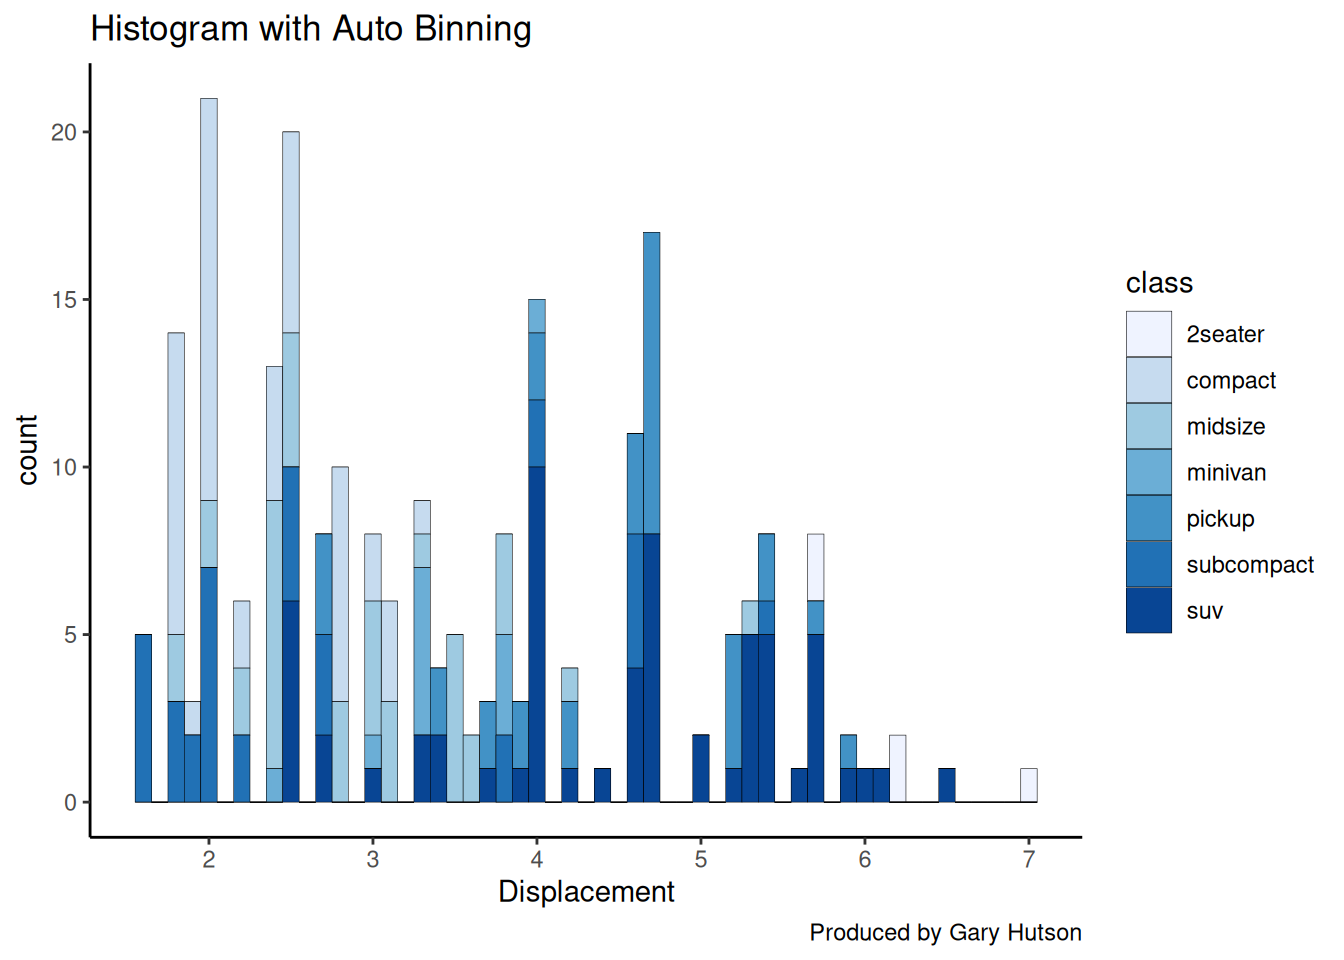
Histogram with auto binning in ggplot2
R tips
ggplot2
base R
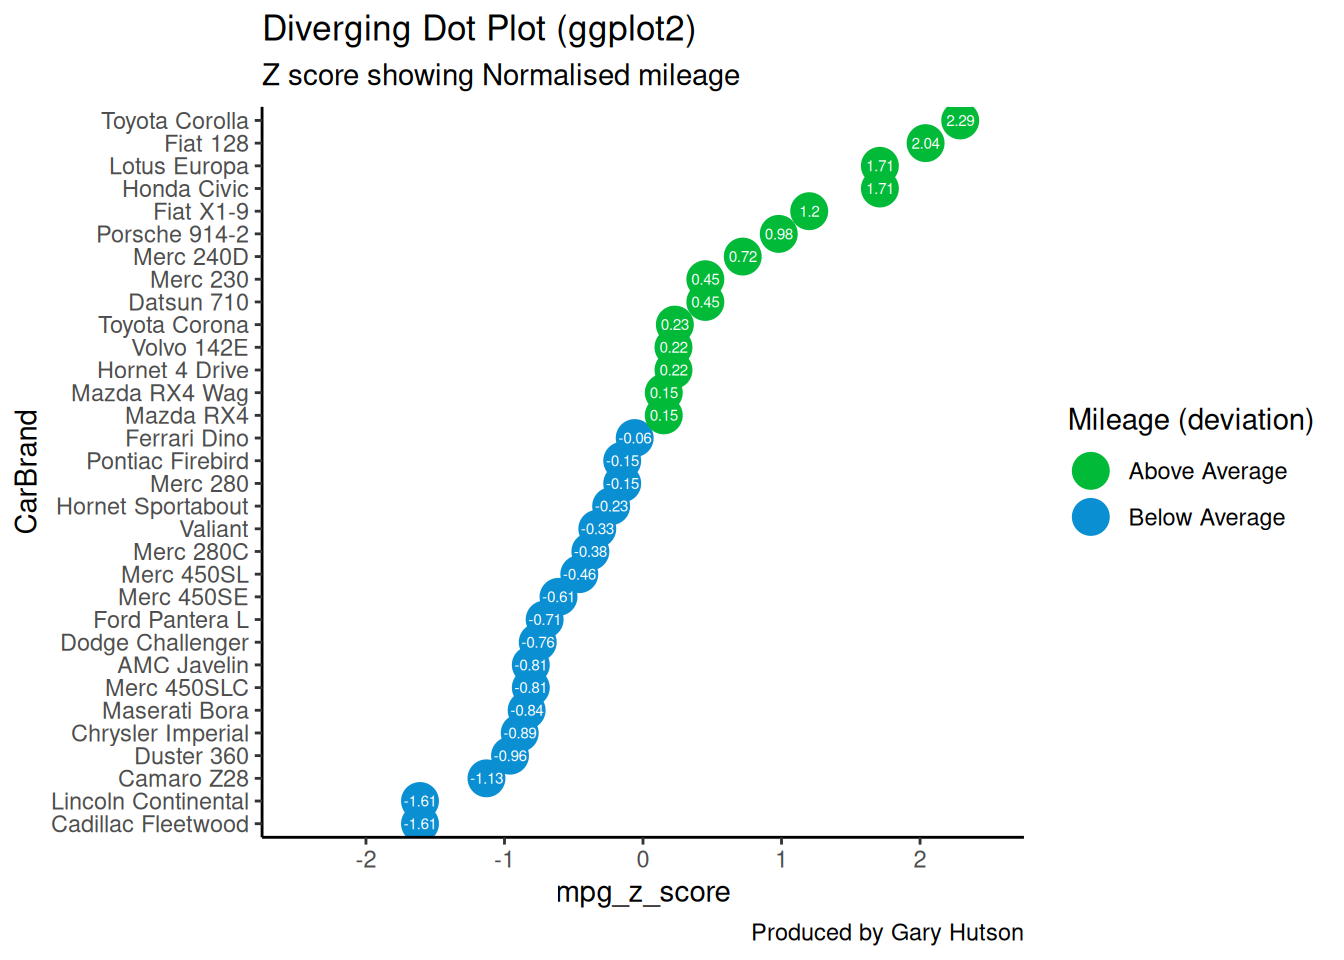
Diverging Dot Plot and Lollipop Charts – Plotting Variance with ggplot2
R tips
ggplot2
base R
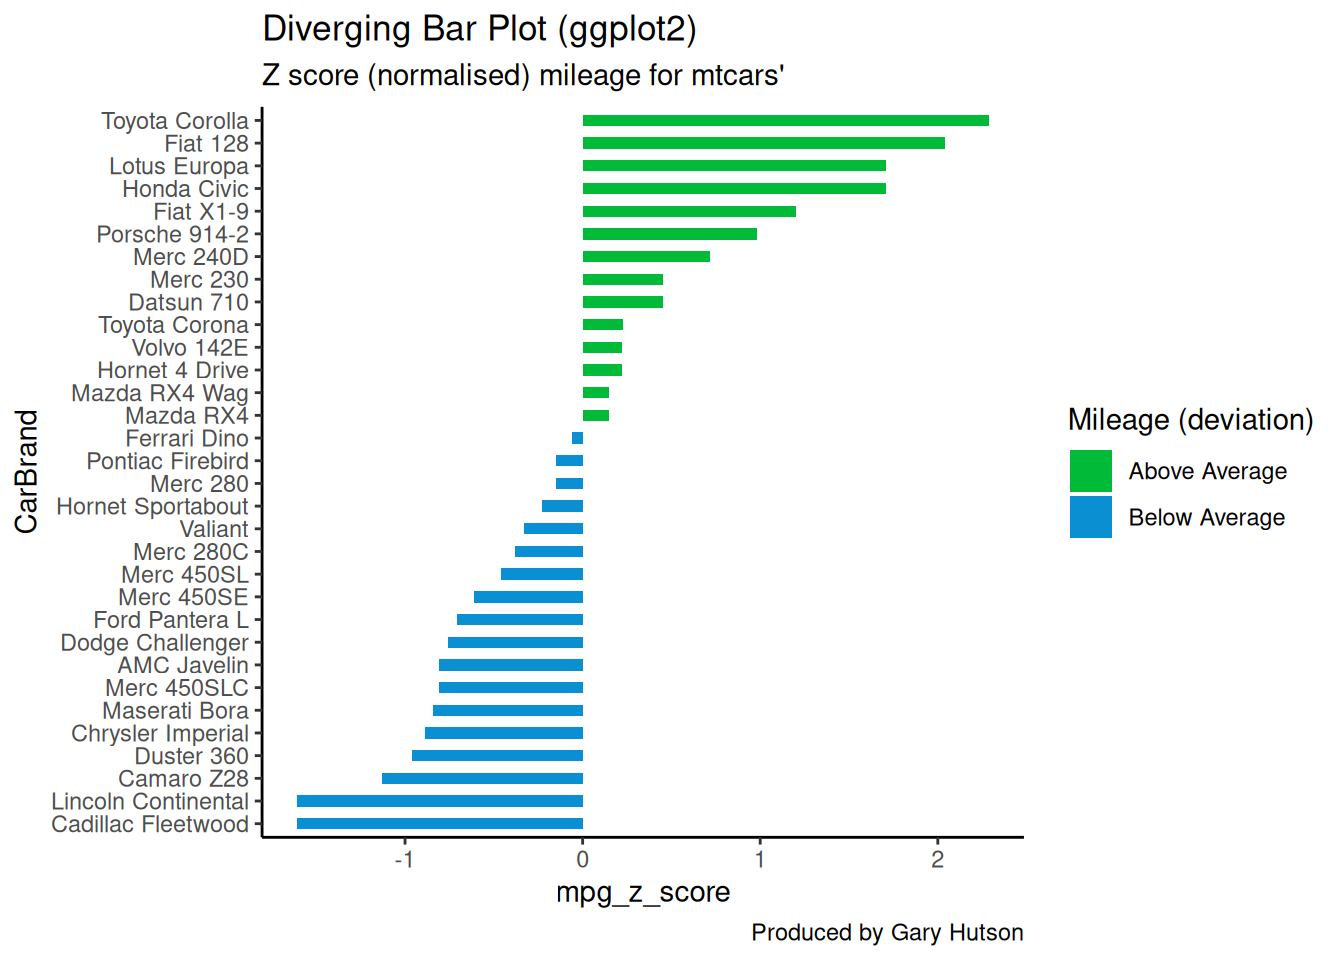
Diverging Bar Charts – Plotting Variance with ggplot2
R tips
ggplot2
base R

![]()
The :: operator
R tips
![]()
R studio shortcuts
R tips
![]()
Importing and exporting Data
R tips
![]()
The joy of R
Reflections
Public Health
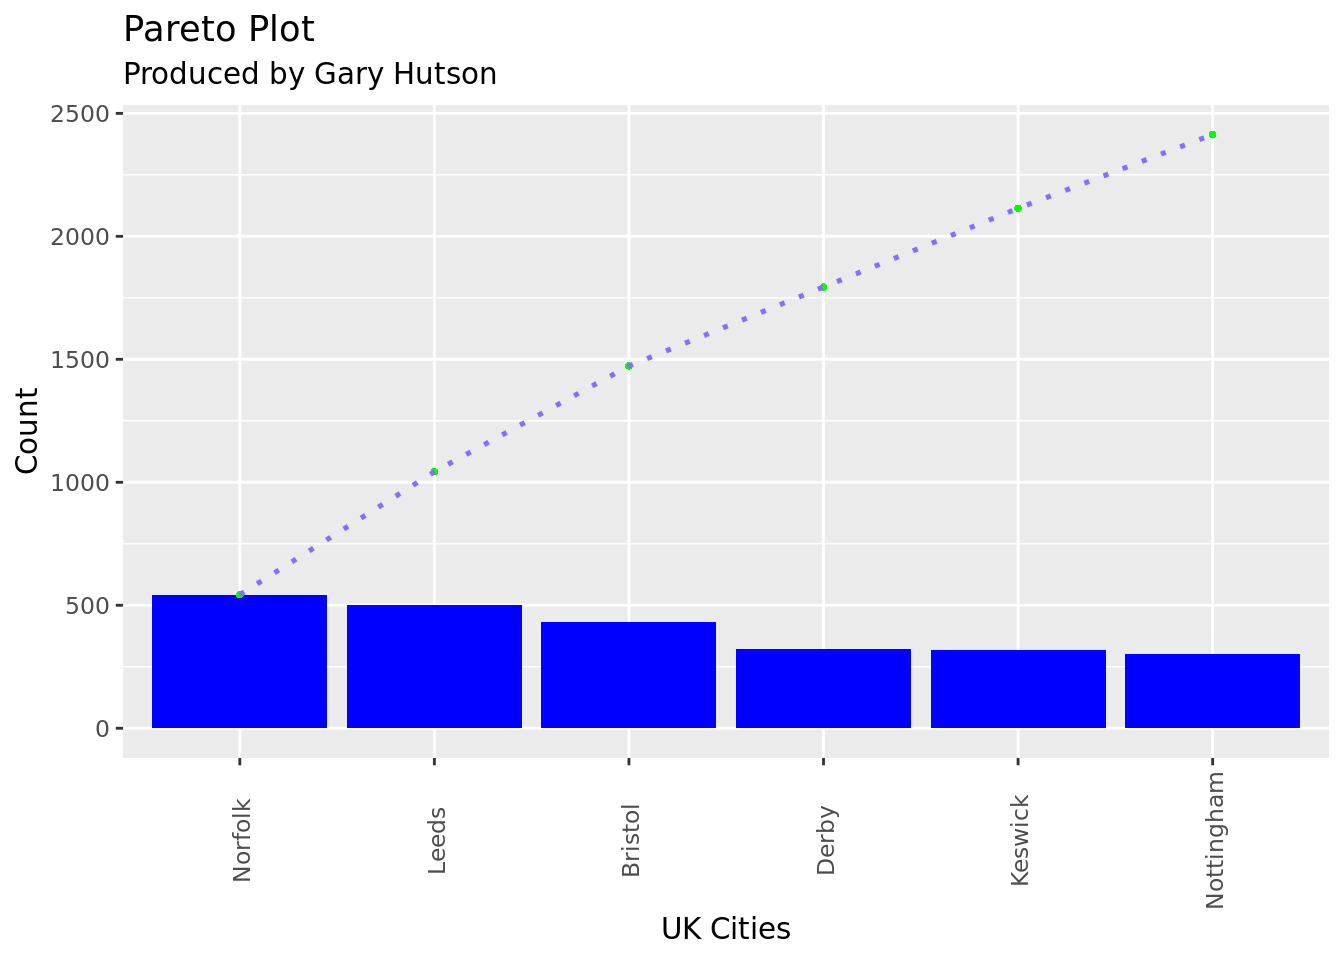
Pareto Chart in ggplot2
R tips
ggplot2
base R
![]()
Aiming for a wrangle-free (or reduced) world
Reflections
![]()
NHS meets R
NHS-R
No matching items